Monitoring a homelab with Prometheus, Loki and Grafana
How do I monitor a homelab with Prometheus, Loki, Grafana and Telegram?
The monitoring runs on the same server it watches, and like everything else since part 2, it lives in the repo: the exporters, the dashboards as JSON, the alert rules, the Telegram contact point. The split is simple. Prometheus collects numbers, Loki collects logs, and Grafana shows both and decides when to write to me.
Metrics: everything ends up in Prometheus
Prometheus scrapes every 30 seconds and keeps 30 days. Most of what it reads comes from the usual exporters: node-exporter for the host, cAdvisor for the containers, smartctl-exporter for the disks, a blackbox exporter that pings the gateway and two public DNS servers, the PostgreSQL exporter. Our own apps expose their own /metrics.
The cheapest part is a feature of node-exporter, the textfile collector: it publishes whatever it finds in .prom files in one directory. So every job on the host, the backup, its weekly check, the monthly restore drill, the Time Machine check, the UPS, the router, ends by writing a few lines like these:
backup_last_run_timestamp_seconds{repo="s3"} 1792027558backup_last_run_success{repo="s3"} 1backup_last_run_duration_seconds{repo="s3"} 291backup_repository_size_bytes{repo="s3"} 30305935097backup_snapshot_count{repo="s3"} 30A shell script that writes five lines is now a time series, with a dashboard and an alert, and no extra service to run.
Logs: the journal, then Loki
Docker’s log driver is journald, so every container writes into the systemd journal, next to the host’s own logs, with the container’s name attached. Grafana Alloy reads the journal and ships everything to Loki, which keeps 30 days. Container lines get a container label, host lines get the systemd unit.
Before, Alloy asked the Docker API for the container logs. dockerd answered by reading the journal itself, once for each of the hundred or so containers, and woke every one of those readers up for each new line. It cost dockerd 14.1 seconds of CPU per minute, against 2.6 after the change, and Loki got every container line twice. On a 4-core box that is not a detail, as part 3 showed for the CI.
Logs can raise alerts too. A few rules query Loki instead of Prometheus, like this one for the API behind TreniTardi, which counts the lines with a Python traceback or an error level in the last ten minutes:
sum(count_over_time({container=~"trenitardi-api.*"} |~ "(?i)(traceback|\"level\": \"(error|critical)\")" [10m]))A dashboard for every service
Every service gets a Grafana dashboard, and the JSON lives in the repo next to everything else. I look at Grafana often, and I admit that nice dashboards are a bit of a fetish. This is part of the one for the internet connection, with the speed tests, the WAN and DHCP status, and the connection tracking table that made the server the router in part 1:
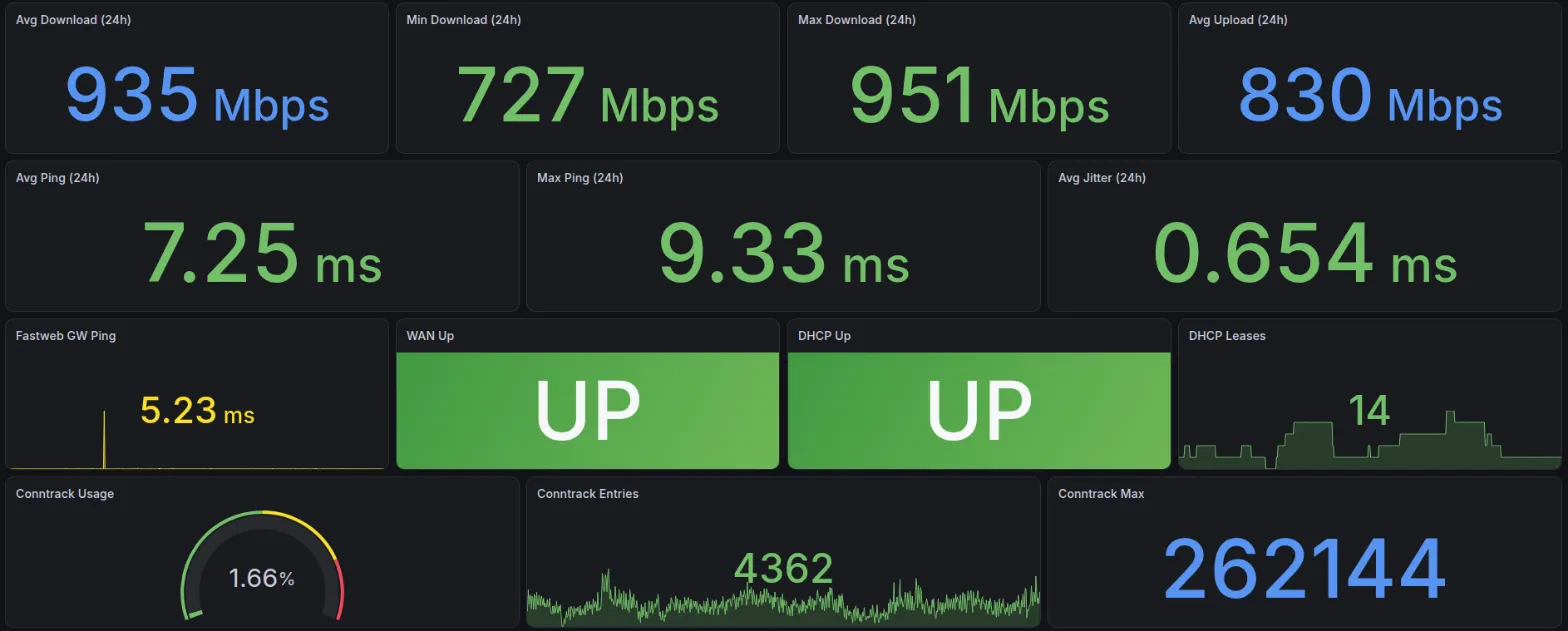
When a panel shows a metric that has an alert, the panel draws the alert’s threshold as a line. The number on the graph and the number that sends the message are the same number.
Alerts: Grafana writes to Telegram
The alert rules are in the repo too, in one file, and Grafana evaluates them. Each one is a query and a threshold. Telegram receives them because it is convenient: we never looked at the alternatives, maybe one day we will.
Until recently there was a second set of rules in Prometheus. Prometheus had no Alertmanager, so those rules were evaluated and their alerts never reached anyone, including the Time Machine ones from part 5. The ones worth keeping moved to Grafana, duplicates and noise were deleted, and now alerts live in one place.
The notification policy decides how much Telegram I get. Alerts are grouped by folder and name, and a firing alert repeats every 12 hours, not every few minutes. One alert depends on a data feed that goes stale on its own several times a week, so it has its own route: no “resolved” message, and one reminder a day:
policies: - orgId: 1 receiver: telegram group_by: - grafana_folder - alertname group_wait: 30s group_interval: 5m repeat_interval: 12h routes: - receiver: telegram-no-resolve object_matchers: - ["alertname", "=", "TreniTardi Italo Real Time Stale"] repeat_interval: 24hIn the 30 days before I wrote this, Grafana raised 55 alerts, about two a day. The ones that made me act were about hardware: a disk running out of space, and the SMART alerts. For bad sectors the rule watches the growth, not the total: the backup disk has carried the same count of reallocated sectors for at least a month, and an alert on the total would fire forever.
Two more details matter. A collector that stops writing is a failure too: the Time Machine rule treats missing data as an alert, so a dead check cannot look like a healthy one. And a few rules run every minute instead of every five, because a memory burst like the one that killed Traefik is over before a slower rule looks again.
What I would add
Nothing, for now. I’m happy with it. Time Machine in part 5 is the whole loop on one service: the metrics a script writes, the dashboard, and the alerts that come from it.